Tree-based method towards the Estimation of the Conditional Average Treatment Effect of Education on Earning


  • Huaning Liu¹
  • Noah Simpson¹
  • Xue Wang¹
  • Wenqian Zhao¹

Find Out More

Introduction


Education is a crucial factor in the development of a thriving and prosperous society. From increasing economic growth to promoting civic engagement, education continues to be the key determinant of success in various aspects of life, especially career prospects and high-status income levels[3]. Therefore, We intend to estimate the Conditional Average Treatment Effect (CATE) of education level on earning using the “honest” estimator proposed in the paper Comprehension and Reproduction of Recursive Partitioning for Heterogeneous Causal Effects, written by Susan Athey and Guido Imbens[1]. Cate is designed to capture heterogeneity of a treatment effect across subpopulations when the unconfoundedness assumption applies. The authors created and benchmarked the unbiased estimator of CATE across subsets of the population with different treatments, proposing an “honest” approach for estimation.

Research Problems


1. The CATE of college education on yearly income for different years, being 2010, 2000, and 1990.

2. The CATE of college education on yearly income for males and females in 2010.

3. The CATE of college education on yearly income for different age groups in 2010, being people in their 30s, 40s, and 50s.

Learn More about our project


[1] Susan Athey and Guido Imbens. Recursive partitioning for heterogeneous causal effects. Proceedings of the National Academy of Sciences, 113(27):7353-7360, jul 2016.
[2] Claude E. Shannon. A mathematical theory of communication. Bell System Technical Journal, 27(3):379-423, 1948.
[3] Ulrich Teichler. Higher Education and the World of Work: Conceptual Frameworks, Comparative Perspectives, Empirical Findings. Sense Publishers, 2009.

Methodology


Casual Tree Data EDA

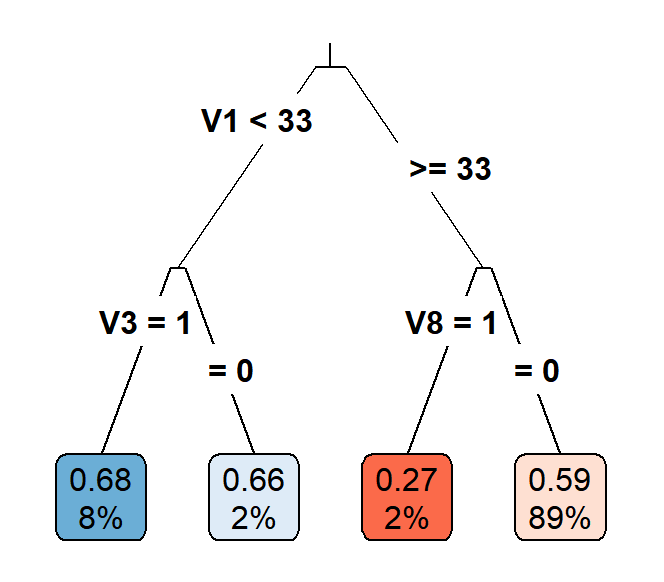
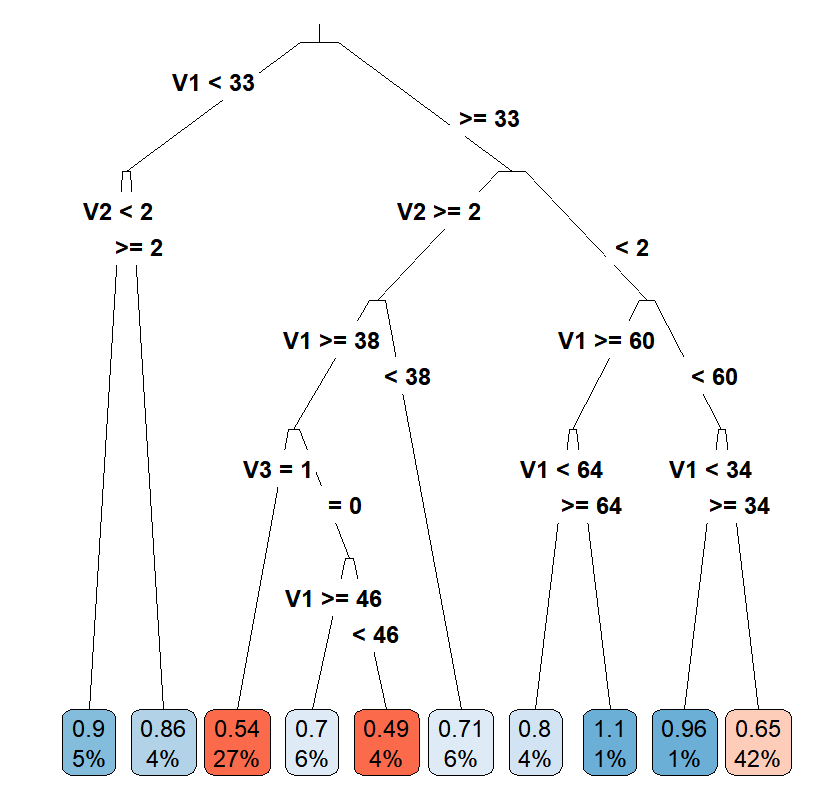
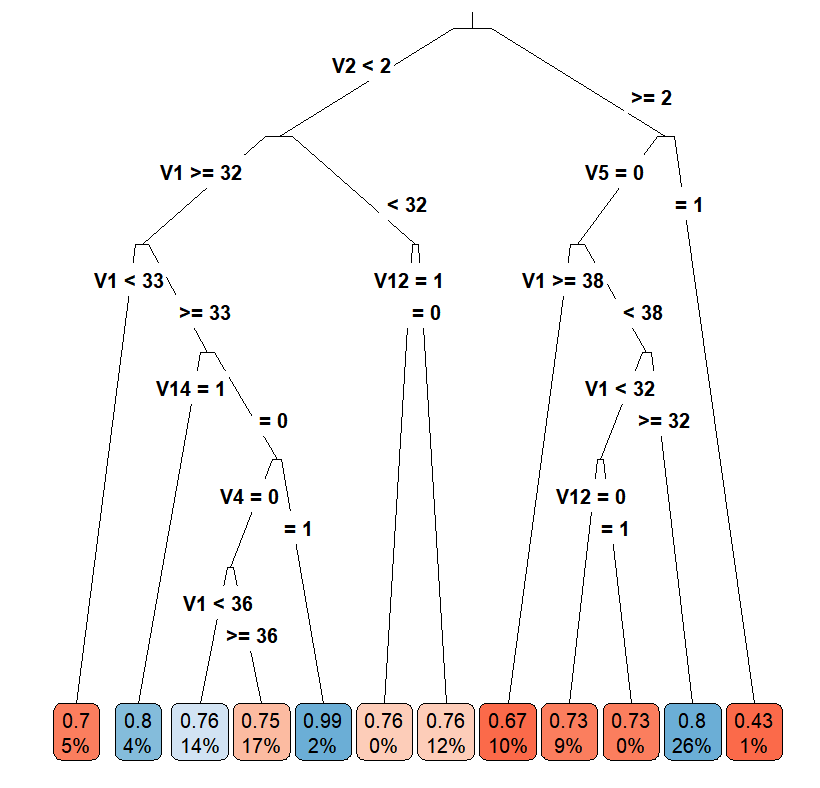
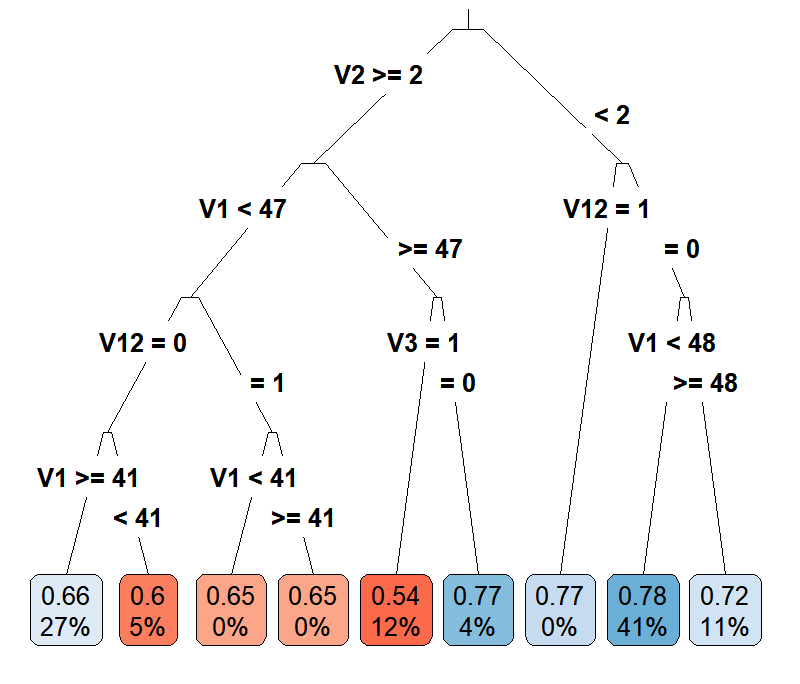
Casual Tree & CATE Estimation

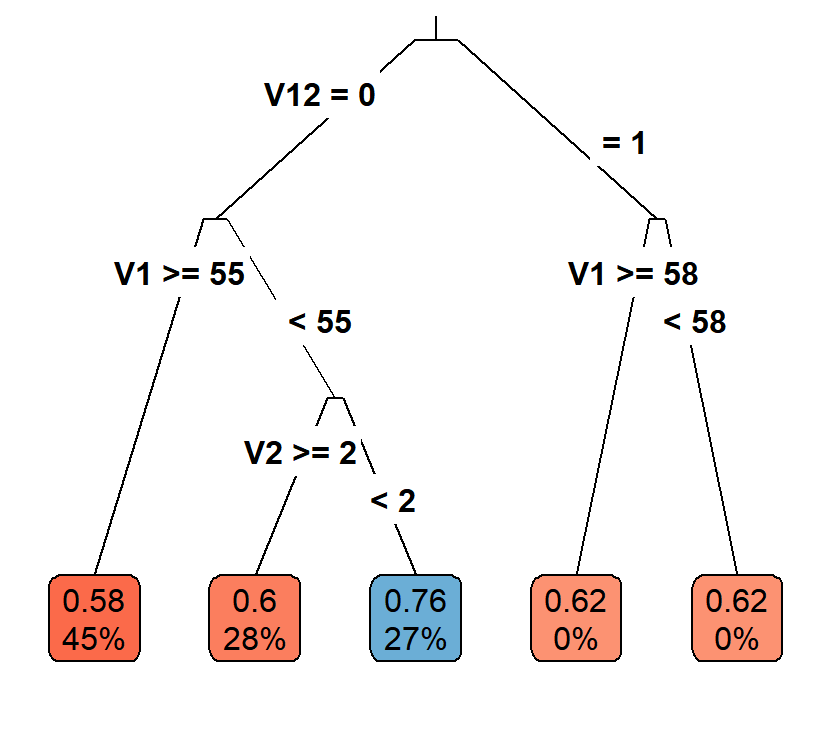
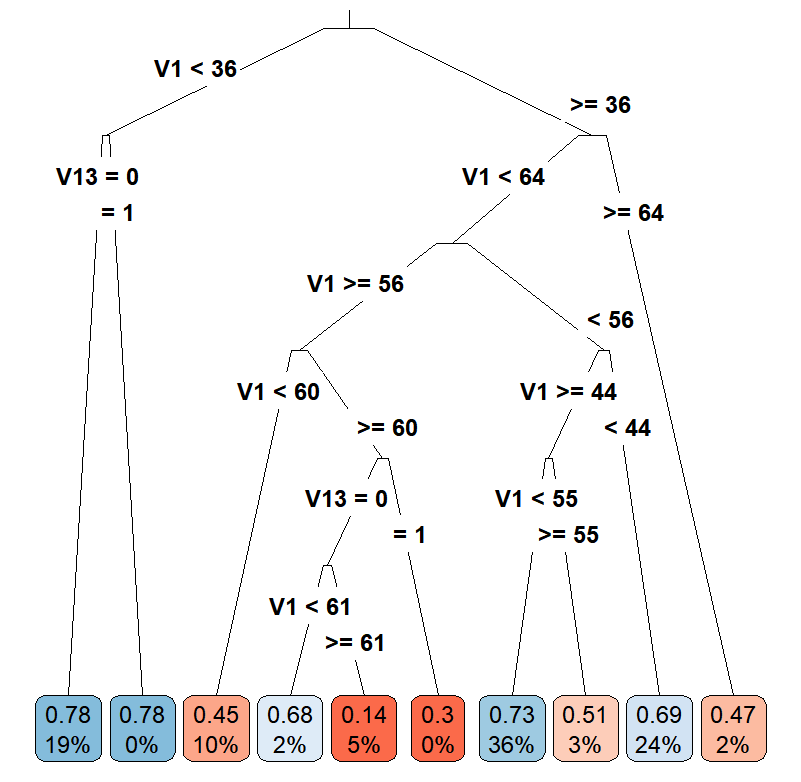
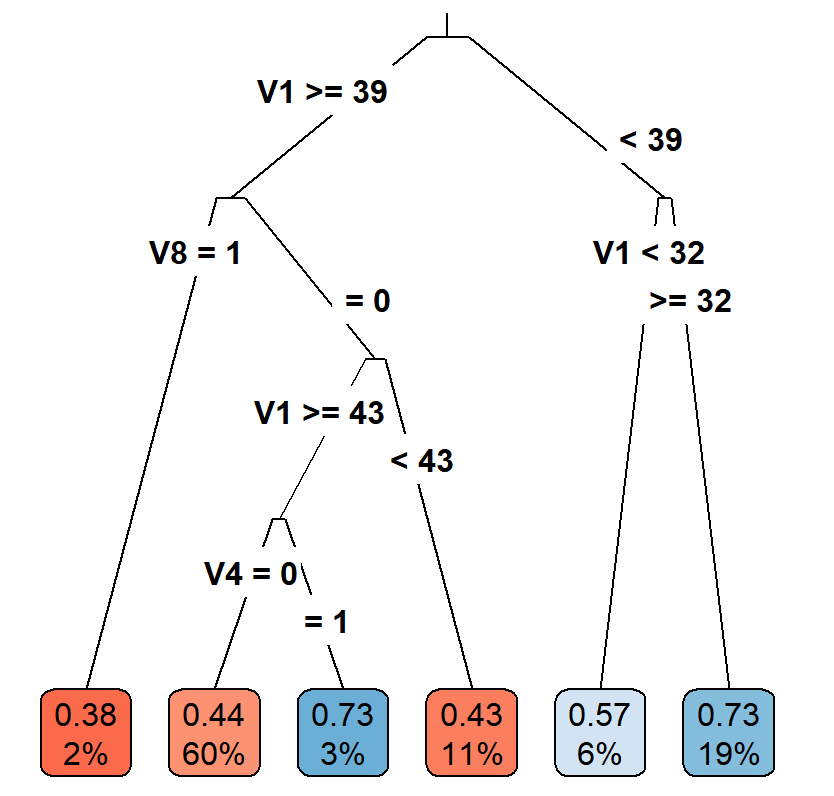
The "honest" approach used for building and validating the Causal Tree is an extension and divergence from the classification and regression trees(CART) algorithm. One of the most important concerns is to find criteria to evaluate and compare estimators for treatment effects. Due to the fact that we cannot observe both \(Y_i(1)\) and \(Y_i(0)\) for an individual, the true treatment effect \(\tau\) is also not observable since we are missing half of the \(Y^{obs}\). Thus, the "honest" version of \(EMSE_{\tau}(\Pi)\): \[EMSE_{\tau}(\Pi)\equiv\mathbb{E}_{S^{te},S^{est}}[MSE_{\tau}(S^{te},S^{est},\Pi)]\] is not feasible as we have no knowledge about \(\tau_i\). Therefore, the paper proposed an estimator for \(EMSE_{\tau}(\Pi)\) by modifying the \(MSE_{\mu}\) in CART to get an unbiased estimator \(\widehat{MSE}_{\tau}\) for the treatment effect and the \(EMSE_{\tau}(\Pi)\) in "honest" algorithm to get an unbiased estimator \(\widehat{EMSE}_{\tau}(S^{tr},N^{est},\Pi)\) for \(EMSE_{\tau}(\Pi)\). Let \(p\) denote the proportion of the treated individuals in a leaf, \(S_{control}^{tr}\) denote the subsample of the control group in the training sample, and \(S_{treat}^{tr}\)$ denote the subsample of the treatment group in the training sample, the unbiased estimator for \(EMSE_{\tau}(\Pi)\) for splitting is defined as \[-\widehat{EMSE}_{\tau}(S^{tr},N^{est},\Pi)\equiv\frac{1}{N^{tr}}\sum_{i \in S^{tr}}\hat{\tau}^2(X_i;S^{tr},\Pi)-(\frac{1}{N^{tr}}+\frac{1}{N^{est}})\cdot \sum_{l \in \Pi}(\frac{S_{S_{treat}^{tr}}^2(l)}{p}+\frac{S_{S_{control}^{tr}}^2(l)}{1-p}).\] Using the same equation as the splitting criterion with cross-validation sample, the unbiased estimator of \(EMSE_{\tau}(\Pi)\) for cross-validation is \(-\widehat{EMSE}_{\tau}(S^{tr,cv},N^{est},\Pi)\).

Data Source & Dataset Description

We queried the IPUMS database to attain U.S. census microdata from around 1980 to 2020. To start with our investigation, we processed the data for them to fit in our model:
- Treatment Variable(W): EDUC, education level transformed to binary scale, indicating whether the individual finished college or not.
- Outcome Variable(Y ): INCWAGE, natural log of the yearly wage of an individual.
- Covariates(X): other features extracted such as AGE, SEX, RACE, etc.

Explanatory Data Analysis

We plotted the distribution of the variables relevant to our research question to get a more general sense. From the EDAs, we can observe a clear difference in wages across decades and education levels, as well as a difference in education level across ages, which motivate our incentive to investigate the heterogenous CATE of education.

box
Wages by decades
3d
Educ-Age-Wage
age
Complete rate

Timeline


Results


Conclusion


We have found positive CATE of education on earnings among all of the three research ques- tions. The CATE is larger in recent decades and for younger people. Unexpectedly, there was no significant difference found between the CATE of males and females.


Trees and discovery under different conditions

Each leave of a tree represent the CATE of that group, and average CATE is the average of that values across all leaves


CATE across Decades


The corresponding average CATE estimation across leaves for the 1990s, 2000s, and 2010s are 0.481, 0.547, and 0.771. Therefore, we conclude that later decades would produce a deeper tree and a larger CATE of education on income.

30s
Tree by 1990
40s
Tree by 2000
50s
Tree by 2010

CATE across Ages


The corresponding average CATE estimation across leaves for people in their 30s, 40s, and 50s are 0.74, 0.679, and 0.645. Hense, similar to the former problem, the tree produced is deeper and the CATE is larger for the younger population, which is in our expectation. However, the difference in the tree depth and CATE is not as large as that over decades.

30s
Tree from age 30s
40s
Tree from age 40s
50s
Tree from age 50s

CATE across Genders


The corresponding average CATE estimation across leaves for males and females in 2010 is 0.556 and 0.546. Different from the two above questions, there is no obvious difference in the tree depth and CATE across genders.

30s
Tree by male's data at 2010
40s
Tree by female's data at 2010

Documentations


Our Team


Huaning(Steven) Liu

Team member


Wenqian Zhao

Team member


Xue(Nicole) Wang

Team member


Noah Simpson

Team member


Jelena Bradic

Mentor